Sales Management
The Sales Management page gives sales leaders a single view of revenue, rep activity, and pipeline movement. Use it to compare inside and outside sales performance, review won and lost opportunities, and drill into an individual sales representative’s pipeline.
Use the interactive walkthrough above as the visual guide for this module. It shows the main revenue overview, the sales representative table, filter dropdowns, and the representative detail view.
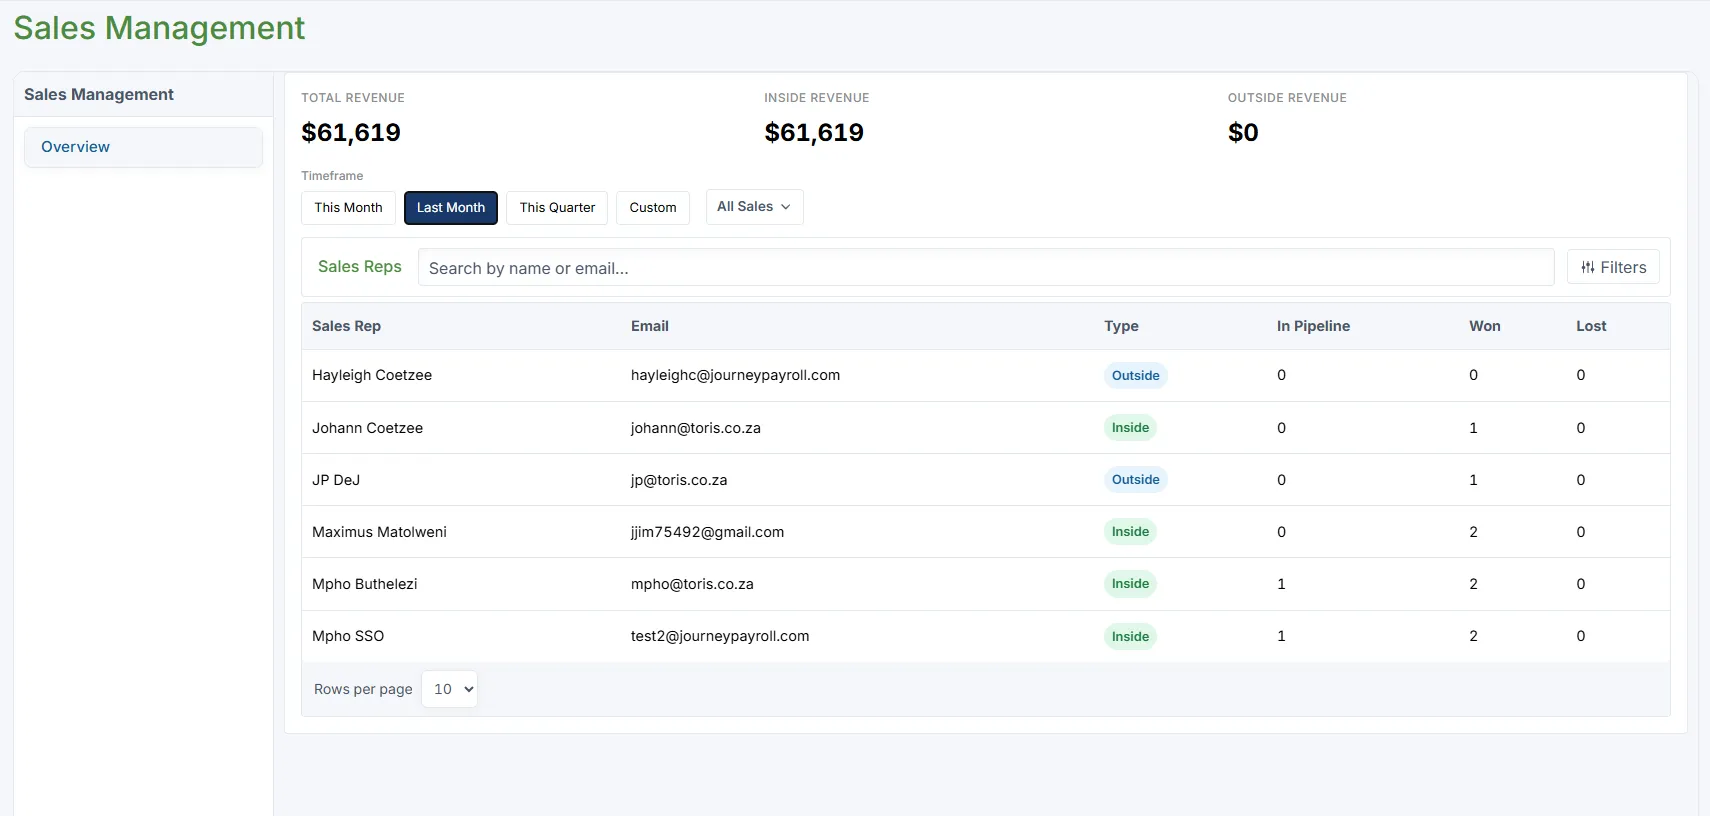
Sales Management overview with revenue totals, timeframe controls, and the sales representative table.
Where to Find It
Section titled “Where to Find It”Open Sales from the left navigation, then select Sales Management.
The page opens on the Overview tab and displays the full sales management workspace.
Revenue Summary
Section titled “Revenue Summary”The top of the page shows three revenue totals for the selected timeframe:
- Total Revenue - All sales revenue included in the current view.
- Inside Revenue - Revenue attributed to inside sales representatives.
- Outside Revenue - Revenue attributed to outside sales representatives.
These totals update when you change the timeframe or sales type filter.
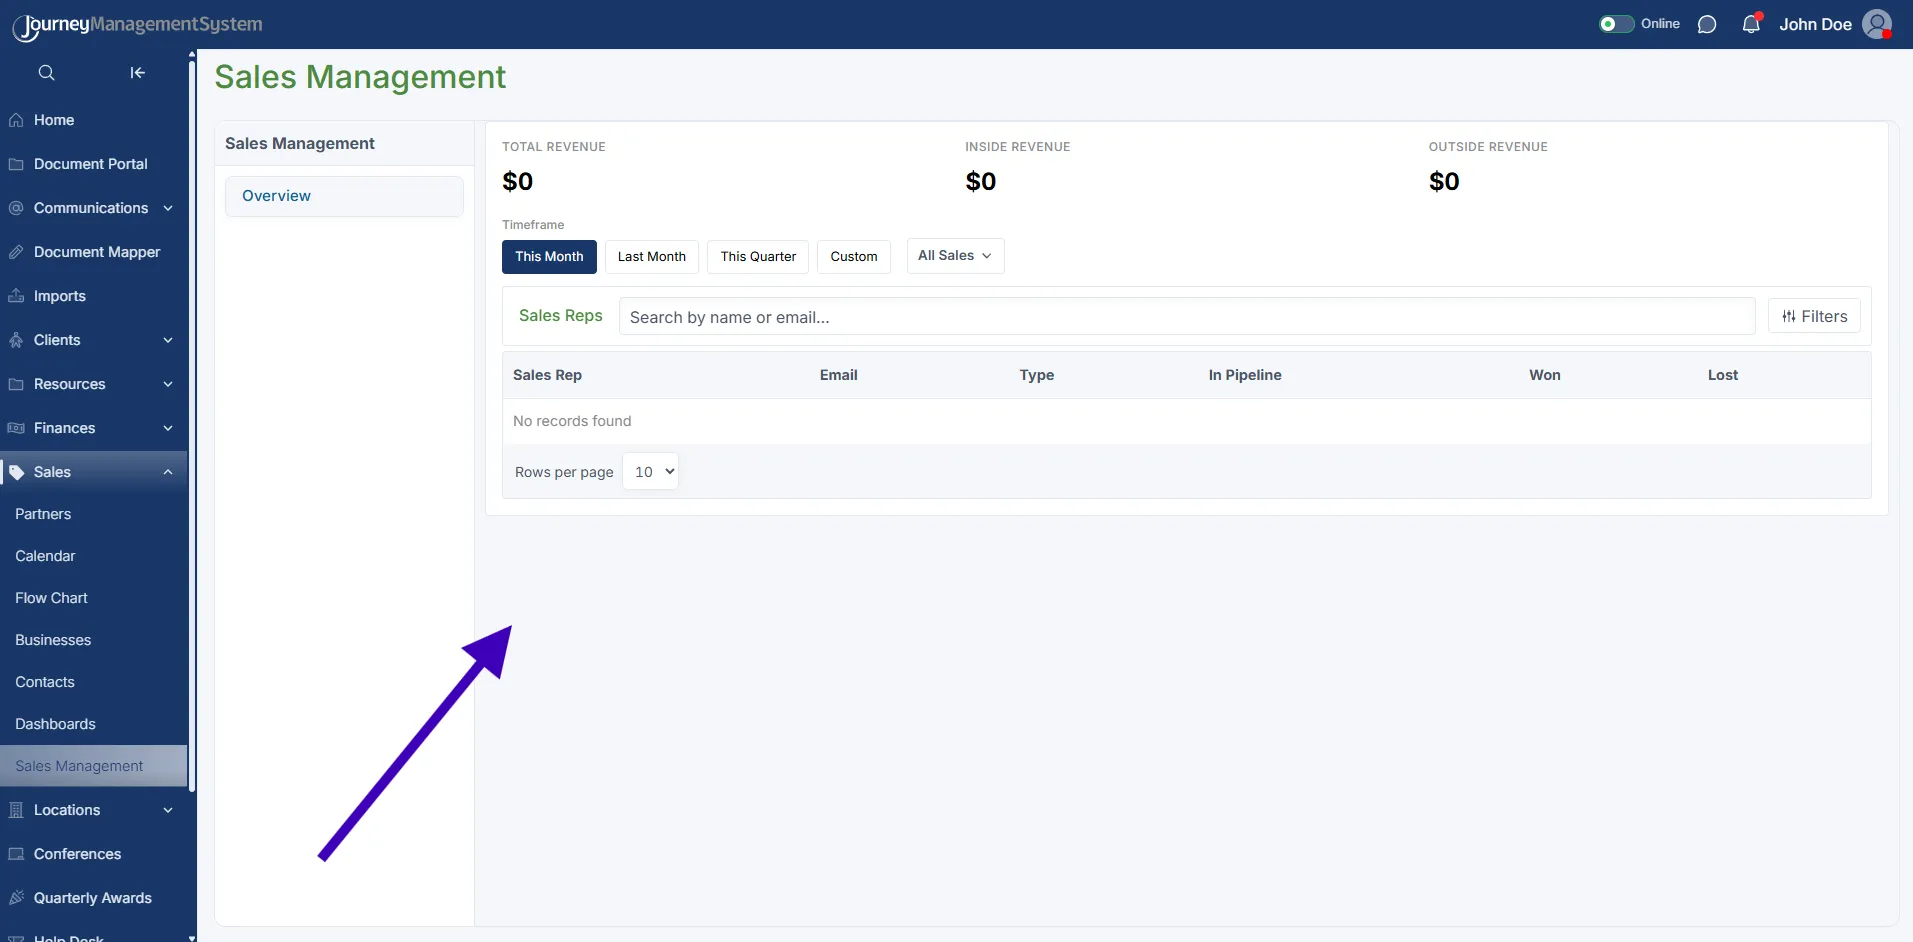
If no records are returned, the same overview layout remains available so you can adjust filters or search again.
Timeframe Filters
Section titled “Timeframe Filters”Use the timeframe buttons to control which sales activity is included:
- This Month - Shows activity for the current month.
- Last Month - Shows activity from the previous month.
- This Quarter - Shows activity for the current quarter.
- Custom - Lets you choose a specific start and end date.
When Custom is selected, enter the required Date Range before reviewing the results.

The custom timeframe adds date range fields so you can report on a specific period.
Sales Type Filter
Section titled “Sales Type Filter”Use the sales type dropdown to narrow the overview by rep type:
- All Sales - Includes both inside and outside sales representatives.
- Inside Sales - Shows only inside sales performance.
- Outside Sales - Shows only outside sales performance.
This filter affects both the revenue totals and the representatives listed in the table.
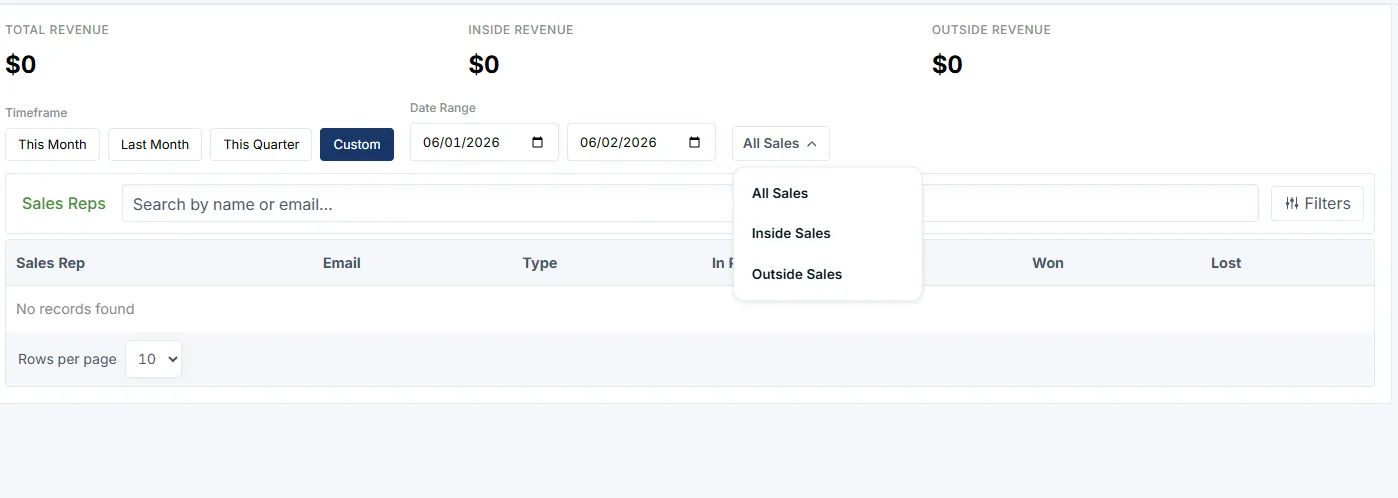
Use the sales type dropdown to compare all sales activity or focus only on inside or outside sales.
Sales Representatives Table
Section titled “Sales Representatives Table”The Sales Reps table lists each representative and their current performance:
| Column | Description |
|---|---|
| Sales Rep | The representative’s name. |
| The representative’s email address. | |
| Type | Whether the rep is marked as Inside or Outside. |
| In Pipeline | Open opportunities currently assigned to the rep. |
| Won | Opportunities won within the selected timeframe. |
| Lost | Opportunities lost within the selected timeframe. |
Use the search field to find a representative by name or email. Use Rows per page at the bottom of the table to control how many records are shown.
If the table shows No records found, adjust the timeframe, clear the search field, or switch the sales type filter back to All Sales.
Representative Details
Section titled “Representative Details”Select a sales representative from the table to open their detailed performance view.
The representative view includes:
- Pipeline Opportunities - Number of open opportunities assigned to the rep.
- Total Pipeline Value - Total value of the rep’s open pipeline.
- Weighted Pipeline - Pipeline value adjusted by opportunity probability.
- Won / Lost - Count of opportunities won and lost.
- Won Revenue - Revenue generated from won opportunities.
- Win Rate - Percentage of closed opportunities that were won.
- Average Cycle Time - Average time taken to close opportunities.
Use this view to understand both the volume and quality of a representative’s pipeline.
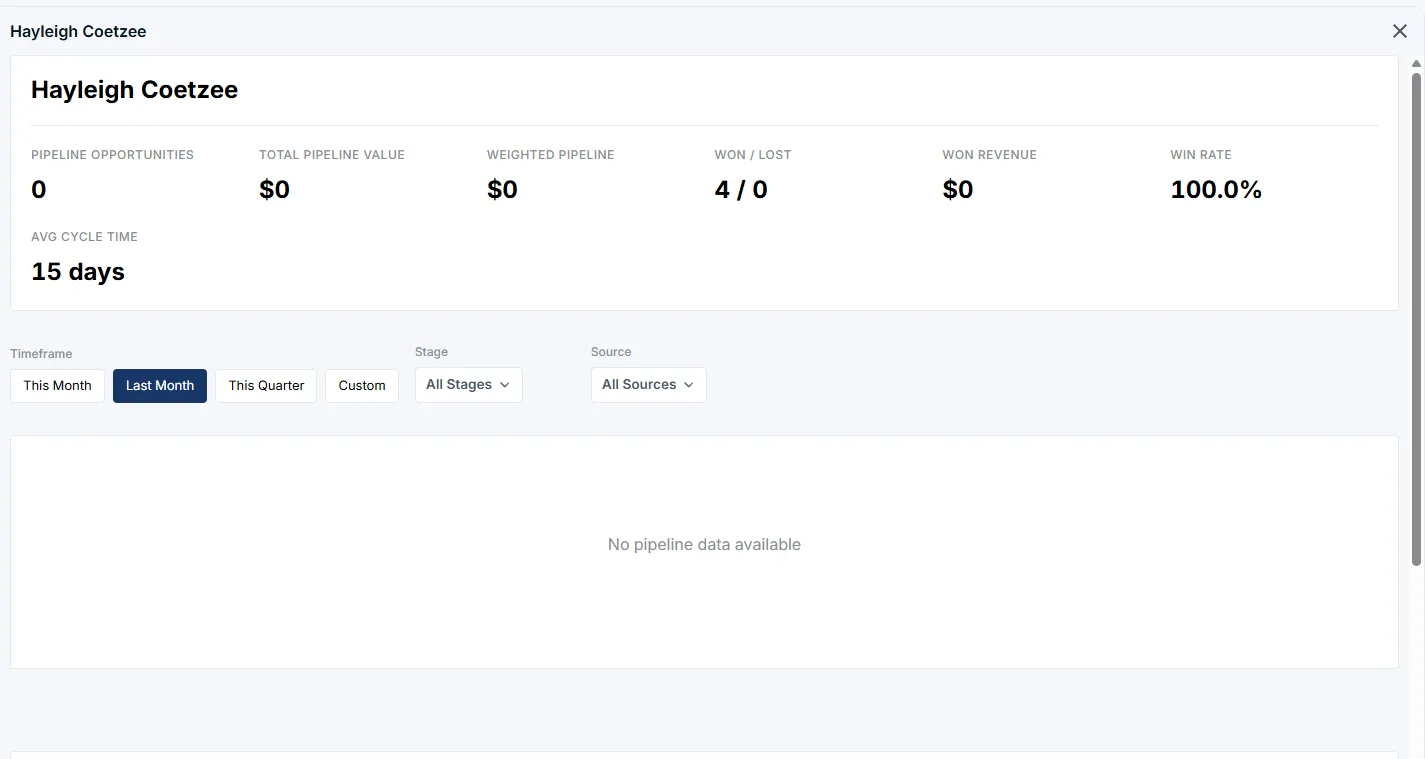
The representative detail view shows pipeline, win rate, revenue, cycle time, and related opportunity tabs.
Detail View Filters
Section titled “Detail View Filters”The representative detail view has its own filters:
- Timeframe - Review the rep’s activity for this month, last month, this quarter, or a custom date range.
- Stage - Filter opportunities by pipeline stage.
- Source - Filter opportunities by origin, such as Website, Referral, Cold Call, Email, LinkedIn, or Other.
These filters are useful when you need to understand where a rep’s opportunities are coming from or which stage is creating bottlenecks.
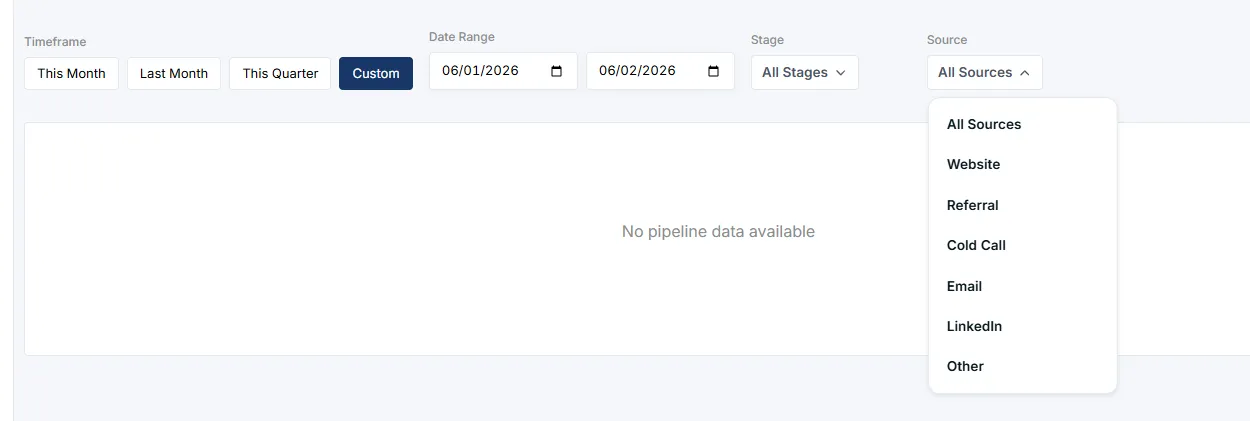
The Source filter helps identify where opportunities originate, including Website, Referral, Cold Call, Email, LinkedIn, and Other.
Pipeline and Closed Tabs
Section titled “Pipeline and Closed Tabs”At the bottom of the representative detail view, use the tabs to switch between:
- Pipeline - Open opportunities still in progress.
- Closed - Opportunities that have already been won or lost.
If no pipeline data is available, the selected rep does not currently have open opportunities matching the filters.
Recommended Workflow
Section titled “Recommended Workflow”- Select the timeframe you want to review.
- Use All Sales, Inside Sales, or Outside Sales to focus the summary.
- Review the revenue totals at the top of the page.
- Search for a representative or scan the table for pipeline, won, and lost counts.
- Open a representative to review their detailed pipeline metrics.
- Use Stage and Source filters to identify where opportunities are progressing or stalling.
Best Practice
Section titled “Best Practice”Review Sales Management during weekly sales meetings to compare rep performance, confirm pipeline health, and identify which opportunity sources are producing the strongest results.